Understanding Data Handling in Molecular Simulations
/ 9 min read
Molecular Simulations: Your Computational Microscope
Imagine being able to look into a microscope and seeing atoms and molecules dance and interact in real-time. That’s exactly what molecular simulations allow scientists to do. They serve as a “computational microscope,” revealing the detailed behaviors that are otherwise invisible to the human eye.
But there’s a catch: simulating the movements of tens of thousands of atoms isn’t a simple task. Each step in the simulation, updating the positions and velocities of particles, requires a hefty amount of computation. (Sounds like a quantum computing problem :D )
Let’s break down what happens in a molecular simulation:
- Determining Potentials: This involves calculating the distances between atoms to understand how they interact.
- Calculating Forces: Based on these potentials, the forces acting on each particle are derived.
- Updating States: Using Newton’s laws of motion, the positions and velocities of particles are updated accordingly.
Given the sheer volume of calculations, it’s crucial to handle data efficiently to ensure that these simulations run smoothly and scale effectively.
Today’s GPUs: Powering Molecular Simulations
GPUs, or Graphics Processing Units have been widely utilized and optimized for artificial intelligence. Originally designed to accelerate graphics in gaming, GPUs have evolved into devices utilized in computing centers capable of handling the parallel, data-intensive tasks required for machine learning, AI, and scientific simulations.
Why Use GPUs for Molecular Simulations?
The computational demands of molecular simulations are a perfect match for the power of GPUs. Simulating the movement and interaction of thousands of atoms involves billions of calculations, many of which can happen independently. This is where GPUs shine, with their ability to handle thousands of operations at the same time, thanks to their parallel architecture.
Here’s why GPUs are revolutionizing for molecular simulations:
- Massive Parallelism: Unlike traditional CPUs, which focus on doing one thing at a time, GPUs excel at handling multiple tasks simultaneously. This is critical for molecular simulations, where interactions between atoms can be calculated in parallel.
- High Throughput: Modern GPUs, such as NVIDIA’s A100 and AMD’s MI250, are incredibly fast, delivering the computing power needed to run simulations more quickly.
- Energy Efficiency: GPUs provide much better performance for the energy they consume compared to CPUs, making them a cost-effective choice for large-scale projects.
- Scalability: GPUs are built to work together across multiple nodes, allowing researchers to scale up their simulations on supercomputers with ease.
The Big Challenges in Molecular Simulations
Running these simulations efficiently isn’t without its brick walls. Here are some of the main challenges researchers face:
- Pinpointing Performance Bottlenecks
- High Data Movement: There’s a constant back-and-forth of data between the processor and memory, which can slow things down.
- Irregular Access Patterns: Accessing memory in a non-contiguous way can lead to cache misses, making the processor wait longer for data.
- Scalability Issues: As the size of the simulation grows, so do the demands on memory and processing power, often in non-linear ways.
- Making the Most of Modern Hardware
Today’s processors are packed with features like multi-level caches, SIMD (Single Instruction, Multiple Data) instructions, and parallel computing units. To harness these effectively, algorithms need to be finely tuned to:
- Enhance Memory Locality: Keeping related data close together to minimize delays.
- Boost Cache Efficiency: Ensuring that frequently accessed data stays in the faster cache memory.
- Maximize Parallel Performance: Leveraging multiple cores and threads to speed up computations.
Diving into Performance with PolyBench
To break down the brick walls, we will use PolyBench Benchmark Suite. Think of PolyBench as a set of stress tests for computational tasks, helping identify where your simulation might be slowing down. It evaluates:
- Memory Utilization: How efficiently your simulation uses the cache, how quickly it can access memory, and the overall data throughput.
- Performance Characteristics: The intensity of computations and how long they take to execute.
Key Benchmarks in PolyBench
- FDTD-2D: Simulates wave propagation, which is pretty memory-heavy.
- GEMM (Matrix Multiplication): A fundamental algorithm used across many scientific applications.
These benchmarks mimic the workloads found in molecular simulations, making them perfect for spotting performance issues.
What to Look For: Key Metrics
When analyzing your simulations, keep an eye on these crucial metrics:
- Cache Performance
- Cache Hits and Misses: The more cache hits you have, the faster your simulation runs. Minimizing cache misses can lead to significant speed-ups.
- Latency and Bandwidth
- Latency: How quickly can data be fetched?
- Bandwidth: How much data can be transferred at once?
- High latency and limited bandwidth can bottleneck your simulations, especially with large datasets.
- Roofline Analysis
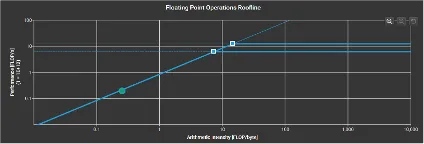
- Roofline Model: This visual tool helps you understand whether your simulation is limited by memory bandwidth or compute power. It plots computational intensity against performance, guiding you on where to focus your optimization efforts.
Similar Projects: ANTON
Anton is a special-purpose supercomputer for biomolecular simulation designed and constructed by D.E. Shaw Research (DESRES). Three generations of Anton machines have thus far been developed, each of which has executed biological MD simulations roughly 100 times faster than the fastest general-purpose supercomputers of its day. Anton systems have twice been awarded the Gordon Bell Prize (2017/2021). The figure below shows details on each of the three systems they have developed.
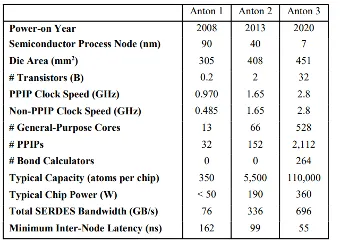
D. E. Shaw et al., paper presented at the Proceedings of the International Conference for High Performance Computing, Networking, Storage and Analysis, St. Louis, Missouri, 2021.
Approach
We leveraged multiple system configurations to study how it performs on different machines with different operating systems, kernels, build date and algorithms such as FDTD-2D and Matrix Multiplications. Also, the compilers and profilers that were used were different between the systems. The steps for this project were to run both the algorithms in every machine, execute it and identify a profiler that would be able to give us our results. The experiments were conducted with varying dataset sizes to evaluate the memory and computational scalability.
Experimental Setup
We used multiple machines for the project to understand how code of that scale works differently on different systems. We used two external systems and three internal systems.
External Systems
-
Bridges 2:
NVIDIA V100 - Cuda Version 12.6.1
Compiler: nvhpc/22.9 - nvcc
Profiler: ncu
-
DeltaGPU:
AMD MI 100 - ROCm version: 6.1.0
Compiler: AMD Clang version 17.0.0
Profiler: rocprof and rocprof V2
Internal Systems
-
Intel Core I7 - 2022
Compiler: gcc 9.4.0
Profiler: valgrind(3.15.0) and GNU gprof (2.34)
-
Intel I7 and GeForce GTX 1050 Compiler: gcc 13.2.0 and nvcc 12.0.140
Profilers: valgrind 3.22.0 and ncu 2022.4.1.0
-
Apple Macbook M1 Pro
Compiler: GCC / Clang 16.0.0
Profiler: Xcode instruments
Struggles
The main struggles for this project were:
-
Apple System Integrity Protection (SIP): The security restriction on macOS limited the ability to run certain profiling tools and access low level information necessary for the performance analysis on the apple system.
-
Slurm setup for Delta GPU: Setting up Slurm for job scheduling on the Delta GPU system was time-consuming because a weather application was monopolizing most of the AMD100 nodes. When you do manage to get access to a compute node, the interactive setup is a bit different from what you’d find on systems like Frontier, Summit, or Perlmutter. On Delta, they use srun not just for running MPI jobs across multiple nodes, but also for accessing an interactive node, unlike the more common salloc command. We had to use srun to get into an interactive session on a compute node to compile the PolyBench code, as the ROCm compiler wasn’t functional on the login nodes.
-
OS limitations: Due to the code requiring header files for unix like systems, the code could not be run on native windows system and had to be shifted to Windows Subsystem for Linux (WSL).
-
Kernel Version: Difference in Kernel Versions within the same system being reported as two different versions was another problem. When looking at the kernel version of WSL from outside the container it claimed to be 5.15.167.4-1 whereas, the kernel version inside the container was 4.4.0-19041-Microsoft. This led to CUDA not being able to run as the Nvidia driver required 5.10 minimum inside the container.
-
Profiling tools: Different tools required different setups and configurations across platforms. There were limitations on the profilers on windows where we could not achieve the desired data.
Results
In order to run on gpus we used a modification of the PolyBench C code. We instead used a code developed by the University of Delaware for parallizing across GPUs, PolyBench-ACC. This code was used to run the FDTD-2D and GEMM algorithms on the GPUs. For the AMD results we ran the OpenCL version, while for the Nvidia results we ran the CUDA version. Similarly for the CPU results we used the PolyBench C code.
Cache Hit CPU
Cache hit rates on CPU showed significant utilization of cache with hit rates almost being to 100% on L1 and closer to 100% on L2. The usage is highly efficient for all dataset sizes, on both the algorithms. The hit rates are no different for the dataset sizes.

Cache Hit Rate GPU
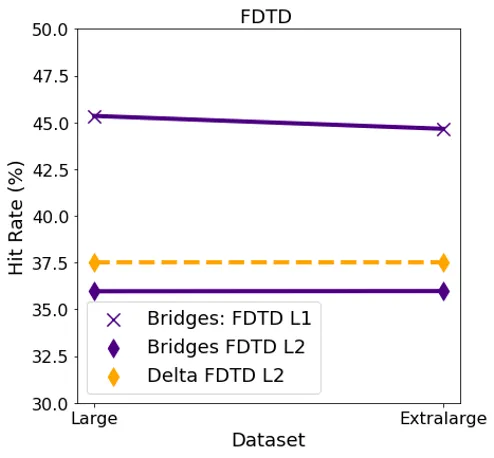
For FDTD, both L1 and L2 cache had consistent hit rates for both the datasets. L1 cache had a comparatively higher hit rate for this algorithm as compared to L2 on both the systems.
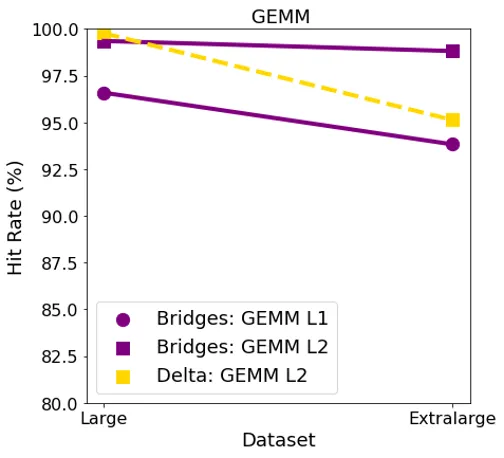
For GEMM, L1 surprisingly had a lower hit rate than L2 in both the systems for large datasets. The hit rates were consistent in the Bridges system for both the datasets. In Delta, hit rate went down as the dataset size increased.
GPU Throughput

Roofline Model
Key observations for the roofline models were that FDTD is memory bound and the algorithm operated near the roofline’s memory limit. This indicates that even if we increase the computational resources, it would not significantly change the result without addressing memory bottlenecks. For matrix multiplication, we could see that the algorithm did not fully utilize the available processing power. We could possibly increase the problem size to improve the performance. It is also very cache heavy which is utilizing a significant amount of cache effectively.
FDTD-2D Large Dataset
FDTD-2D ExtraLarge Dataset

GEMM Large Dataset
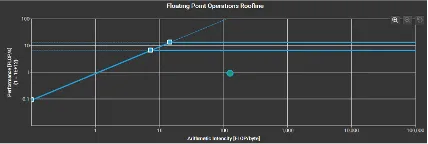
GEMM Extra Large Dataset

Conclusion: What should I take away?
Given the sheer volume of data and calculations involved in molecular simulations, running on large-scale systems such as Bridges2 and DeltaGPU. Our goal is to help scientists identify and address the bottlenecks slowing down their simulations. However, these systems can be challenging to use, with steep learning curves due to differences in configuration and setup. This means the effort required to adapt to a new system must be justified by the performance gains it delivers.
From our findings, FDTD workloads tend to be memory-bound, while GEMM workloads are compute-bound. Despite the challenges, NVIDIA GPUs currently offer the most user-friendly experience for setting up and running simulations. As well as, profiling to see where they can improve in their code.
Good luck optimizing your speedup!